For example, if you prepare six replicate samples and obtain the following peak areas for your analyte:
106.5
104.2
103.7
107.1
99.2
104.7
The values are fairly close together, but what about 99.2? Should this data point be rejected or kept? i.e. Is it a legitimate data point or an outlier? To answer this, we use a test to determine — at a defined confidence limit — the reliability of the data point, known as the Q Test.
We need to compute two values, Qcalculated and Qtable. Qcalculated is obtained as follows: Qcalculated = gap / range
…where gap is the absolute difference between the suspect data point and its nearest neighbor and range is the difference between the highest and lowest values in the data set.
gap = 103.7 – 99.2 = 4.5
range = 107.1 – 99.2 = 7.9
Qcalculated = 4.5 / 7.9 = 0.57
To find Qtable, we look it up in the following table:
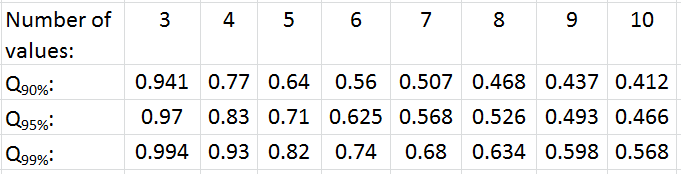
We have 6 data points, so at the 95% confidence level, Qtable= 0.625. The criteria for acceptance or rejection are as follows:
If Qcalculated < Qtable , accept the data point
If Qcalculated > Qtable , reject the data point
Since 0.57< 0.625, the data point can be kept with confidence.