Two Isobaric Amino Acid as Biomarkers Found in Saliva
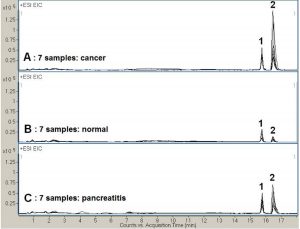
The Chromatogram below shows an interesting aspect of analyzing real patient samples for a pair of metabolites: Glutamine and Lysine. Figure A represents 7 samples taken from patients with cancer; Figure C shows injections of samples from 7 patients with pancreatitis while Figure B represents 7 samples from a control group of healthy people.
In the samples studied generally the Lysine Peak intensity was approximately equal to or greater than the Glutamine Peak intensity in cancer patients while in the normal patients the Lysine Peak was significantly lower in intensity than the Glutamine Peak. Please note the reproducibility of the analysis (retention times) for all samples, despite the variability in the concentration level of the two amino acids in saliva.


Peaks:
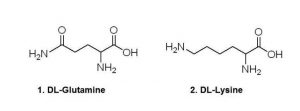
1. D,L – Glutamine (M+H)+, 147.0764 m/z
2. D,L – Lysine (M+H)+, 147.1134 m/z
Method Conditions
Column: Cogent Diamond Hydride™, 4μm, 100Å
Catalog No.: 70000-15P-2
Dimensions: 2.1 x 150mm
Mobile Phase:
—A: DI Water + 10mM Ammonium Acetate
—B: 98% Acetonitrile / 2% 10mM Ammonium Acetate
Gradient:
| Time (minutes) | %B |
| 0 | 100 |
| 14 | 60 |
| 14.1 | 5 |
Temperature: 25°C
Post Time: 5 minutes
Injection vol.: 1μL
Flow rate: 0.4mL / minute
Detection: ESI – pos – Agilent 6210 MSD TOF Mass Spectrometer
t0: 0.8 minutes
Notes: Adapted from: “Analysis of Hydrophilic Metabolites in Physiological Fluids with HPLC-MS using a Silica Hydride- Based Stationary Phase”, J.J. Pesek, M.T. Matyska, J.A. Loo, S.M. Fischer, T.R. Sana, J. Sep. Sci., 32 (2009) 2200- 2208.
Attachment
No 102 Glutamine and Lysine Analyzed by LCMS pdf 0.2 Mb Download File


