Reproducible Separation from Sample Matrix Peaks
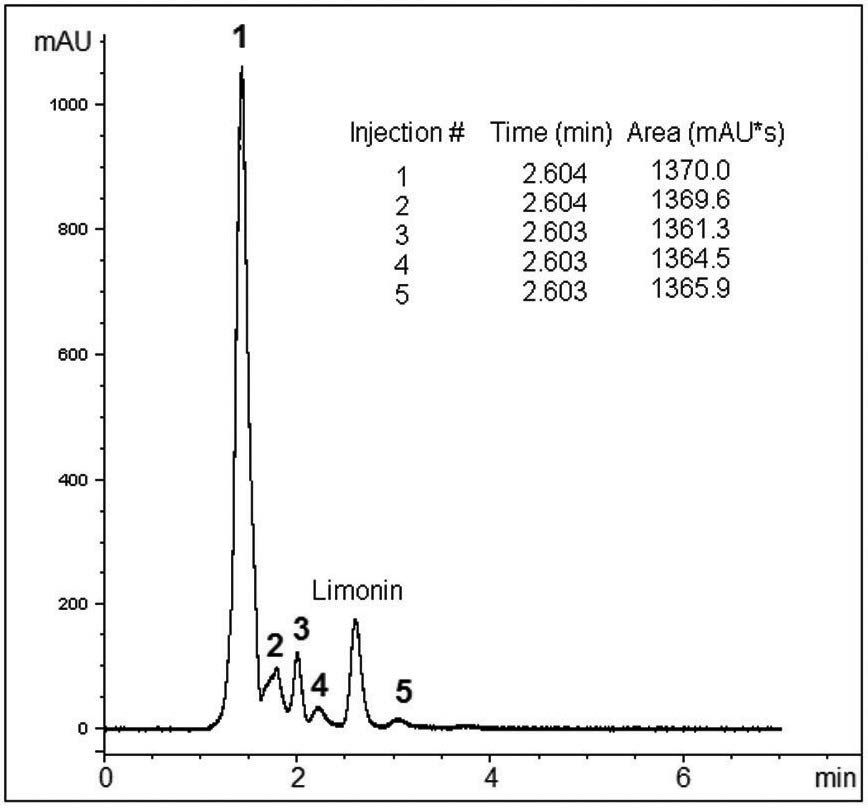
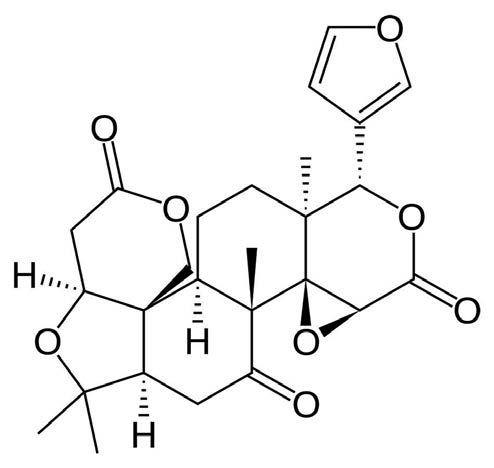
An Orange Juice Sample was spiked at the level of 250 ppm of Limonin and filtered (MicroSolv Tech Corp. 0.45μm Nylon Syringe Filter) before injection. Several Peaks from to the Juice Sample Matrix were separated (peaks1–5), the Limonin peak was well separated from the other Peaks and was easy to integrate. RSD for Peak areas was 0.271 and for Retention Times was 0.021 (5 consecutive injections, shown in chromatogram are overlaid). This Method is fast and is reproducible and could be used to monitor Limonin levels in the production of Juice.


Peaks:
1–5 Orange Juice Matrix
Limonin
Method Conditions
Column: Cogent UDC Cholesterol™, 4μm, 100Å
Catalog No.: 69069-7.5P
Dimensions: 4.6 x 75mm
Mobile Phase:
—40% A: DI Water with 0.1% Formic Acid (v/v)
—60% B: Acetonitrile with 0.1% Formic Acid (v/v)
Injection vol.: 1μL
Flow rate: 0.5mL / minute
Detection: UV @ 220nm
Temperature: 25˚C
Sample Preparation: 500ppm Limonin standard in 20:40:40 DI Water with 0.1% Formic Acid / Acetonitrile / Methanol was prepared. The Orange Juice was filtered and injected “as is” without an additional preparation (data not shown). The Orange Juice was spiked with 250ppm Limonin, filtered, and injected.
t0: 0.9 minutes
Note: Limonin is a bitter compound which may negatively affect juice quality. The compound is found in the seeds and membrane tissue of the fruit. It is very important for groves to determine the level of Limonin in juice so the correct recovery settings for the juice production can be set. The level of Limonin can change dramatically from season to season. It also depends on the fruit size. The analysis of Limonin is crucial in production of high quality non-bitter fruit juices.
Attachment
No 282 Limonin in Orange Juice Analyzed with HPLC pdf 0.3 Mb Download File


