Know when to discard an outlier data point in HPLC by using the Q Test - How To
April 14, 2020
/
/
/
/
/
/
/
For example, if you prepare six replicate samples and obtain the following peak areas for your analyte:
We need to compute two values, Qcalculated and Qtable. Qcalculated is obtained as follows: Qcalculated = gap / range
...where gap is the absolute difference between the suspect data point and its nearest neighbor and range is the difference between the highest and lowest values in the data set.
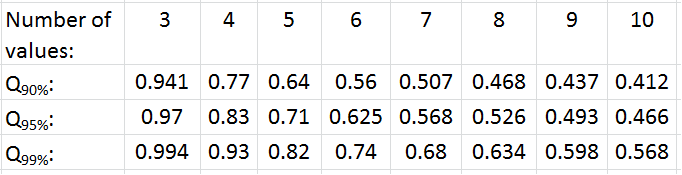
We have 6 data points, so at the 95% confidence level, Qtable= 0.625. The criteria for acceptance or rejection are as follows:
106.5
104.2
103.7
107.1
99.2
104.7
We need to compute two values, Qcalculated and Qtable. Qcalculated is obtained as follows: Qcalculated = gap / range
...where gap is the absolute difference between the suspect data point and its nearest neighbor and range is the difference between the highest and lowest values in the data set.
gap = 103.7 – 99.2 = 4.5
range = 107.1 – 99.2 = 7.9
Qcalculated = 4.5 / 7.9 = 0.57
We have 6 data points, so at the 95% confidence level, Qtable= 0.625. The criteria for acceptance or rejection are as follows:
If Qcalculated < Qtable , accept the data point
If Qcalculated > Qtable , reject the data point