Measure signal to noise ratio in an HPLC chromatogram - How to
July 10, 2017
/
/
/
/
/
The best way is to zoom in on the peak of interest using your data analysis software so that the baseline near the peak is also visible as well.
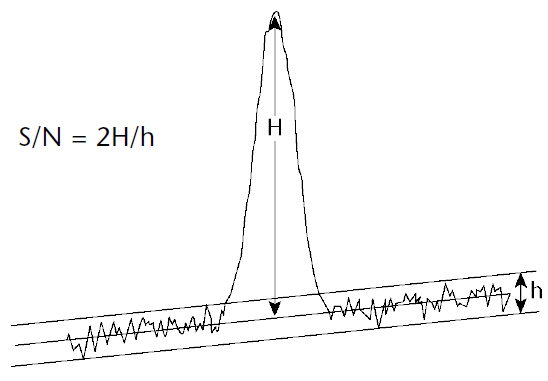
Depending on how sharp or narrow your peak is, you'll want to zoom in so that the time axis covers a range of about 0.5 –1.0 min. Measuring the peak height is generally straightforward but the noise level can be a but tricky, since it is by definition random and hence doesn't have an unambiguous height. The best way is to pick several locations around the peak, measure their noise levels, and average the results.
USP <621> delineates the measurement and calculation of the signal-to-noise ratio as follows: