L-Theanine in Green Tea Analyzed with HPLC - Extended AppNote
November 3, 2014
/
/
/
/
/
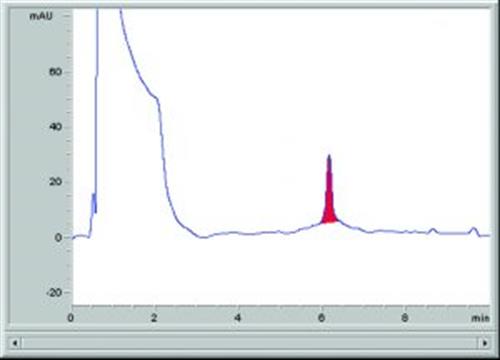
L-Theanine in Green Tea
L-Theanine does not have significant UV absorption, but detection at a low wavelength (200 nm) was found to be suitable. With an expected sample concentration of around 10ppm, a calibration curve in the range 2–200 ppm would be appropriate.
The data showed good linearity in the studied range, with a line of best fit of y = 12.32x – 7.643 and an r2 value of 0.99995.
Click below to download full Method Conditions
Attachment
L-Theanine in Green Tea Analyzed with HPLC pdf 0.3 Mb Download File